Trader Joe's

Trader Joe’s
How might we improve the in-store navigation experience for Trader Joe’s customers?
Skills Used
Discovery Research
Choosing our client
Results of the team voting session regarding client choice
For this group project we were given the challenge of improving the in-store navigation experience for a retailer of our choice. Therefore, the first step of the project became choosing our client. As a team we each came up with client suggestions and then discussed the rationale behind those choices. Some of the suggestions that were proposed can be seen to the right. We ended up conducting a voting session on MURAL so that each team member could vote on their top three client options. In the end, we ended up choosing Trader Joe’s as it was unanimously the most popular amongst the group and we decided their product offering was specific enough to allow us to slightly narrow the scope of the project.
Secondary Research — Understanding Trader Joe’s Business and customers
Next we needed to gain a better understanding of our client, Trader Joe’s. We started by completing secondary research into things such as Trader Joe’s business model, their current digital strategy and their typical customer. Regarding Trader Joe’s business model we learned that they operate roughly 546 stores across 43 states and in those stores prioritize things such as high quality and diverse products, great prices, a limited selection and providing a fun and welcoming in-store experience. Research into Trader Joe’s digital strategy provided us with insights regarding Trader Joe’s current lack of an app, a large unaffiliated social following for the store and also provided inspiration for our eventual design. Finally, gaining a better understanding of the type of customer that typically shops at Trader Joe’s provided us with a jumping off point regarding who to survey when starting our primary research.
Current Trader Joe’s website
Trader Joe’s has a large unaffiliated social following
Profile of a typical Trader Joe’s customer
understanding people’s shopping habits and experiences with Trader Joe’s
After learning more about Trader Joe’s through secondary research, we realized we still needed more information about customer’s general shopping behaviors and experiences with Trader Joe’s. In order to gather insights surrounding these areas we created a survey that we sent out to people who fell within Trader Joe’s typical customer demographics. In this survey we asked basic demographic information such as the respondent’s location and how many people the respondent typically shops with and for. Next we asked the respondent to recall the last time they went to Trader Joe’s in order to answer questions regarding that particular in-store experience. The full survey can be found here. We distributed the survey to different people in our personal circles and ended up getting 70 responses. A lot of very valuable information and important insights were gathered through this survey.
Most customers use Trader Joe’s for supplemental shopping
Many customers go to Trader Joe’s for their specialty items
Concepting and Ideation
Survey synthesis through affinity mapping
The survey we created included many short answer questions about the respondent’s previous Trader Joe’s experiences. In order to better visualize these short answer responses we created an affinity diagram. On MURAL we created sticky notes that accurately captured the short answer responses and then started grouping them based on themes we saw. We also decided to split the stickies into two categories, supplemental shoppers and primary shoppers. In the images below the supplemental shopper responses can be found on the purple sticky notes while the primary shopper responses can be found on the yellow sticky notes. This ended up being a very important distinction as we uncovered major differences between these two personas and this differentiation eventually led to the development of our specific target customer. The groups that we created during this affinity mapping exercise can be seen below.
Development of our target persona
Our target persona
As mentioned above, during the affinity mapping exercise we noticed that the themes we were uncovering were differing largely dependent on whether or not Trader Joe’s was the respondents primary grocery store or if they used it for supplemental shopping. Therefore, in order for us to narrow the scope of our project, we decided it would be important for us to determine which of these personas we wanted to target. In the end, we chose to target what we like to call the “seasonal or supplemental Trader Joe’s shopper”. This is somebody who isn’t doing all of their normal, weekly grocery shopping at Trader Joe’s but is instead going about once a month to look for seasonal or specialty products. More attributes of this target persona can be seen at right.
highlighting persona pain points through journey mapping
To uncover major pain points throughout the shopping journey for our target persona we created a journey map. We broke the shopping experience into four main stages: discovery, planning, shopping and check out or post-shopping. Then we highlighted actions and behaviors, thoughts and emotions and pain points at each of these stages based on information we got from our survey. This step was important as it helped us more clearly see which actions were being done at each stage and more importantly where there were pain points that we might be able to address.
Provisional journey map
Jessica’s polished current journey with pain points highlighted
uncovering main opportunity areas — Led to New How Might We questions
Being able to better visualize the pain points throughout the user’s journey led to the main opportunity areas for this project. We ended up identifying an opportunity area for each stage of the user journey. The opportunity areas and their corresponding journey stages can be seen in the center picture below. Next we decided to narrow these opportunity areas even more and ended up coming up with our final guiding how might we questions. Those questions were: How might we help Jessica discover new specialty Trader Joe’s products to reduce the fear of missing out? How might we seamlessly integrate shopping lists into the in-store shopping experience? How might we help Jessica find what she is looking for while also giving her the opportunity to wander and explore?
Opportunity area brainstorming
Final four opportunity areas we decided on
Our opportunity areas led to these three HMW questions
Brainstorming through crazy 8s
Ideas brainstormed during Crazy 8 exercise with votes from team voting session
After we uncovered the opportunity areas we wanted to explore, the experience team decided it would be important to get the rest of the team involved in the brainstorming stage. We held a workshop involving the entire team and ideated by doing Crazy 8s. We completed four, 8 minute rounds, one for each of the specific opportunity areas. The goal of each round was to have team members come up with, and articulate, as many ideas related to that particular opportunity area as possible. While Crazy 8s are typically down with sketching, the virtual format of our workshop did not efficiently allow for this so instead team members just succinctly captured their ideas with words. Once we had completed all four rounds we did another MURAL voting session where each team member got around 32 votes so that they could vote on their favorite ideas.
narrowing down features
Next the experience team took the most highly voted on ideas from the Crazy 8s and grouped them together to uncover main features desired by the team. When doing this grouping and final feature ideating we made sure that what we were coming up with aligned with out persona, journey map and how might we questions. Finally we came up with a list of five main features that our solution should include. These five features were: customizable navigation routes, gamifying the way finding process, shared shopping lists, product recommendation and in stock notification in the planning stage.
Feature grouping
The main features we decided on
Design and Prototyping
feature sketching
After coming up with specific feature ideas, each member of the team worked on finding online inspiration and then used those examples to guide ideas for feature sketches. We first focused on sketching for the navigation feature and then moved on to the social feature.
Sketches and analogous inspiration for navigation feature
Sketches and analogous inspiration for social feature
More sketches and analogous inspiration for navigation feature
More sketches and analogous inspiration for social feature
finalizing feature flows and requirements
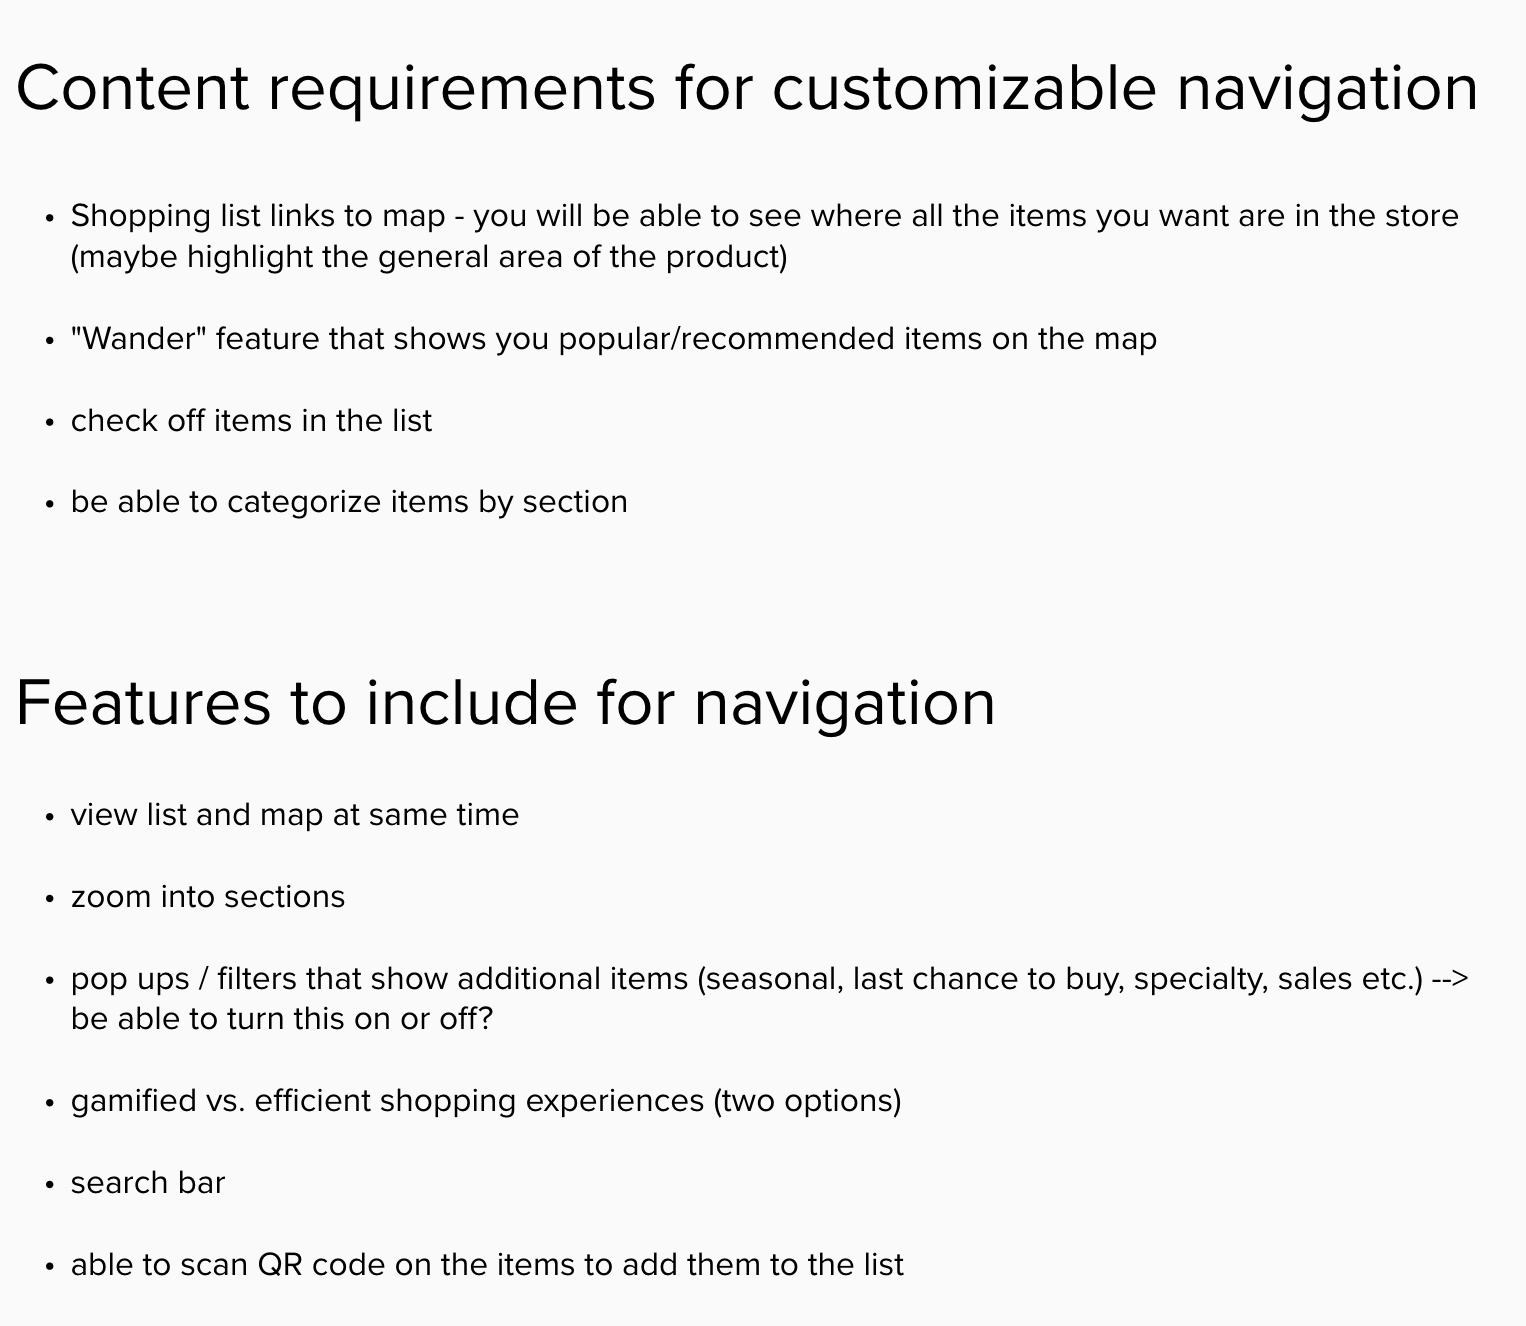
After separating to do this work, we came back together as a team to discuss the examples we found and the sketches we created. Next, we decided on which parts of each person’s sketches we liked the most and combined these into specific content and design requirements for each feature. This led to a list of requirements for both the navigation and the social feature. To provide even more detail, we came up with a user story and flow that incorporated all of the feature requirements we determined. At this point we assigned people to take ownership of different parts of the user flow. Each person was then responsible for creating wireframes for their part of the user flow using the feature requirements we agreed on as a team to guide them.

Feature requirements for navigation feature
User flow for navigation feature
Feature requirements and user flow for social feature
low-fidelity wireframe creation
Before we separated to work on the wireframes for our individual parts of the user story we worked together to create a standard base for all of us to use. We agreed on things like the bottom nav, a font, font sizes and a simple grid. This was an important step to make sure that the initial wireframes we were individually creating had similar components so that it would be easier to combine all of them when it came time. After this we entered an iterative process where we would each work on our specific screens, come back together, go through the screens and discuss what we liked and didn’t like and then would implement changes based on the team’s feedback. Additionally, when we came back together as a team we would look at all of the screens holistically to see what elements we could standardize by creating components to improve consistency across the entire flow. This iterative process yielded many low-fidelity wireframes, some of which can be seen on the right.
style guide creation — using Trader Joe’s website and branding
Before we moved on to improving the fidelity of our wireframes we created an extensive style guide that we based on Trader Joe’s current website and branding. We took the fonts, colors, icons and button styles that were used on the website. As a team we decided what types of buttons and fields were going to be needed on multiple screens and included those in the style guide as well. We used Figma’s text and color styles and components so that everything in the file was standardized. This made it easy to change something in one place and have it update throughout the file. Creating this style guide was a good exercise as style guides and design systems are becoming exceedingly important in the design world.
Improving Wireframe Fidelity
Next we went through all of our low-fidelity wireframes and improved the fidelity by applying the style guide. This was also an iterative process as we would come back together as a team to make sure that everybody was happy with how the screens were looking with the style guide applied. Making use of components and font/color styles made this process relatively seamless.
Final Solution
Prototyped wireframes Highlighting Key Features and organizing materials to pass off to engineers
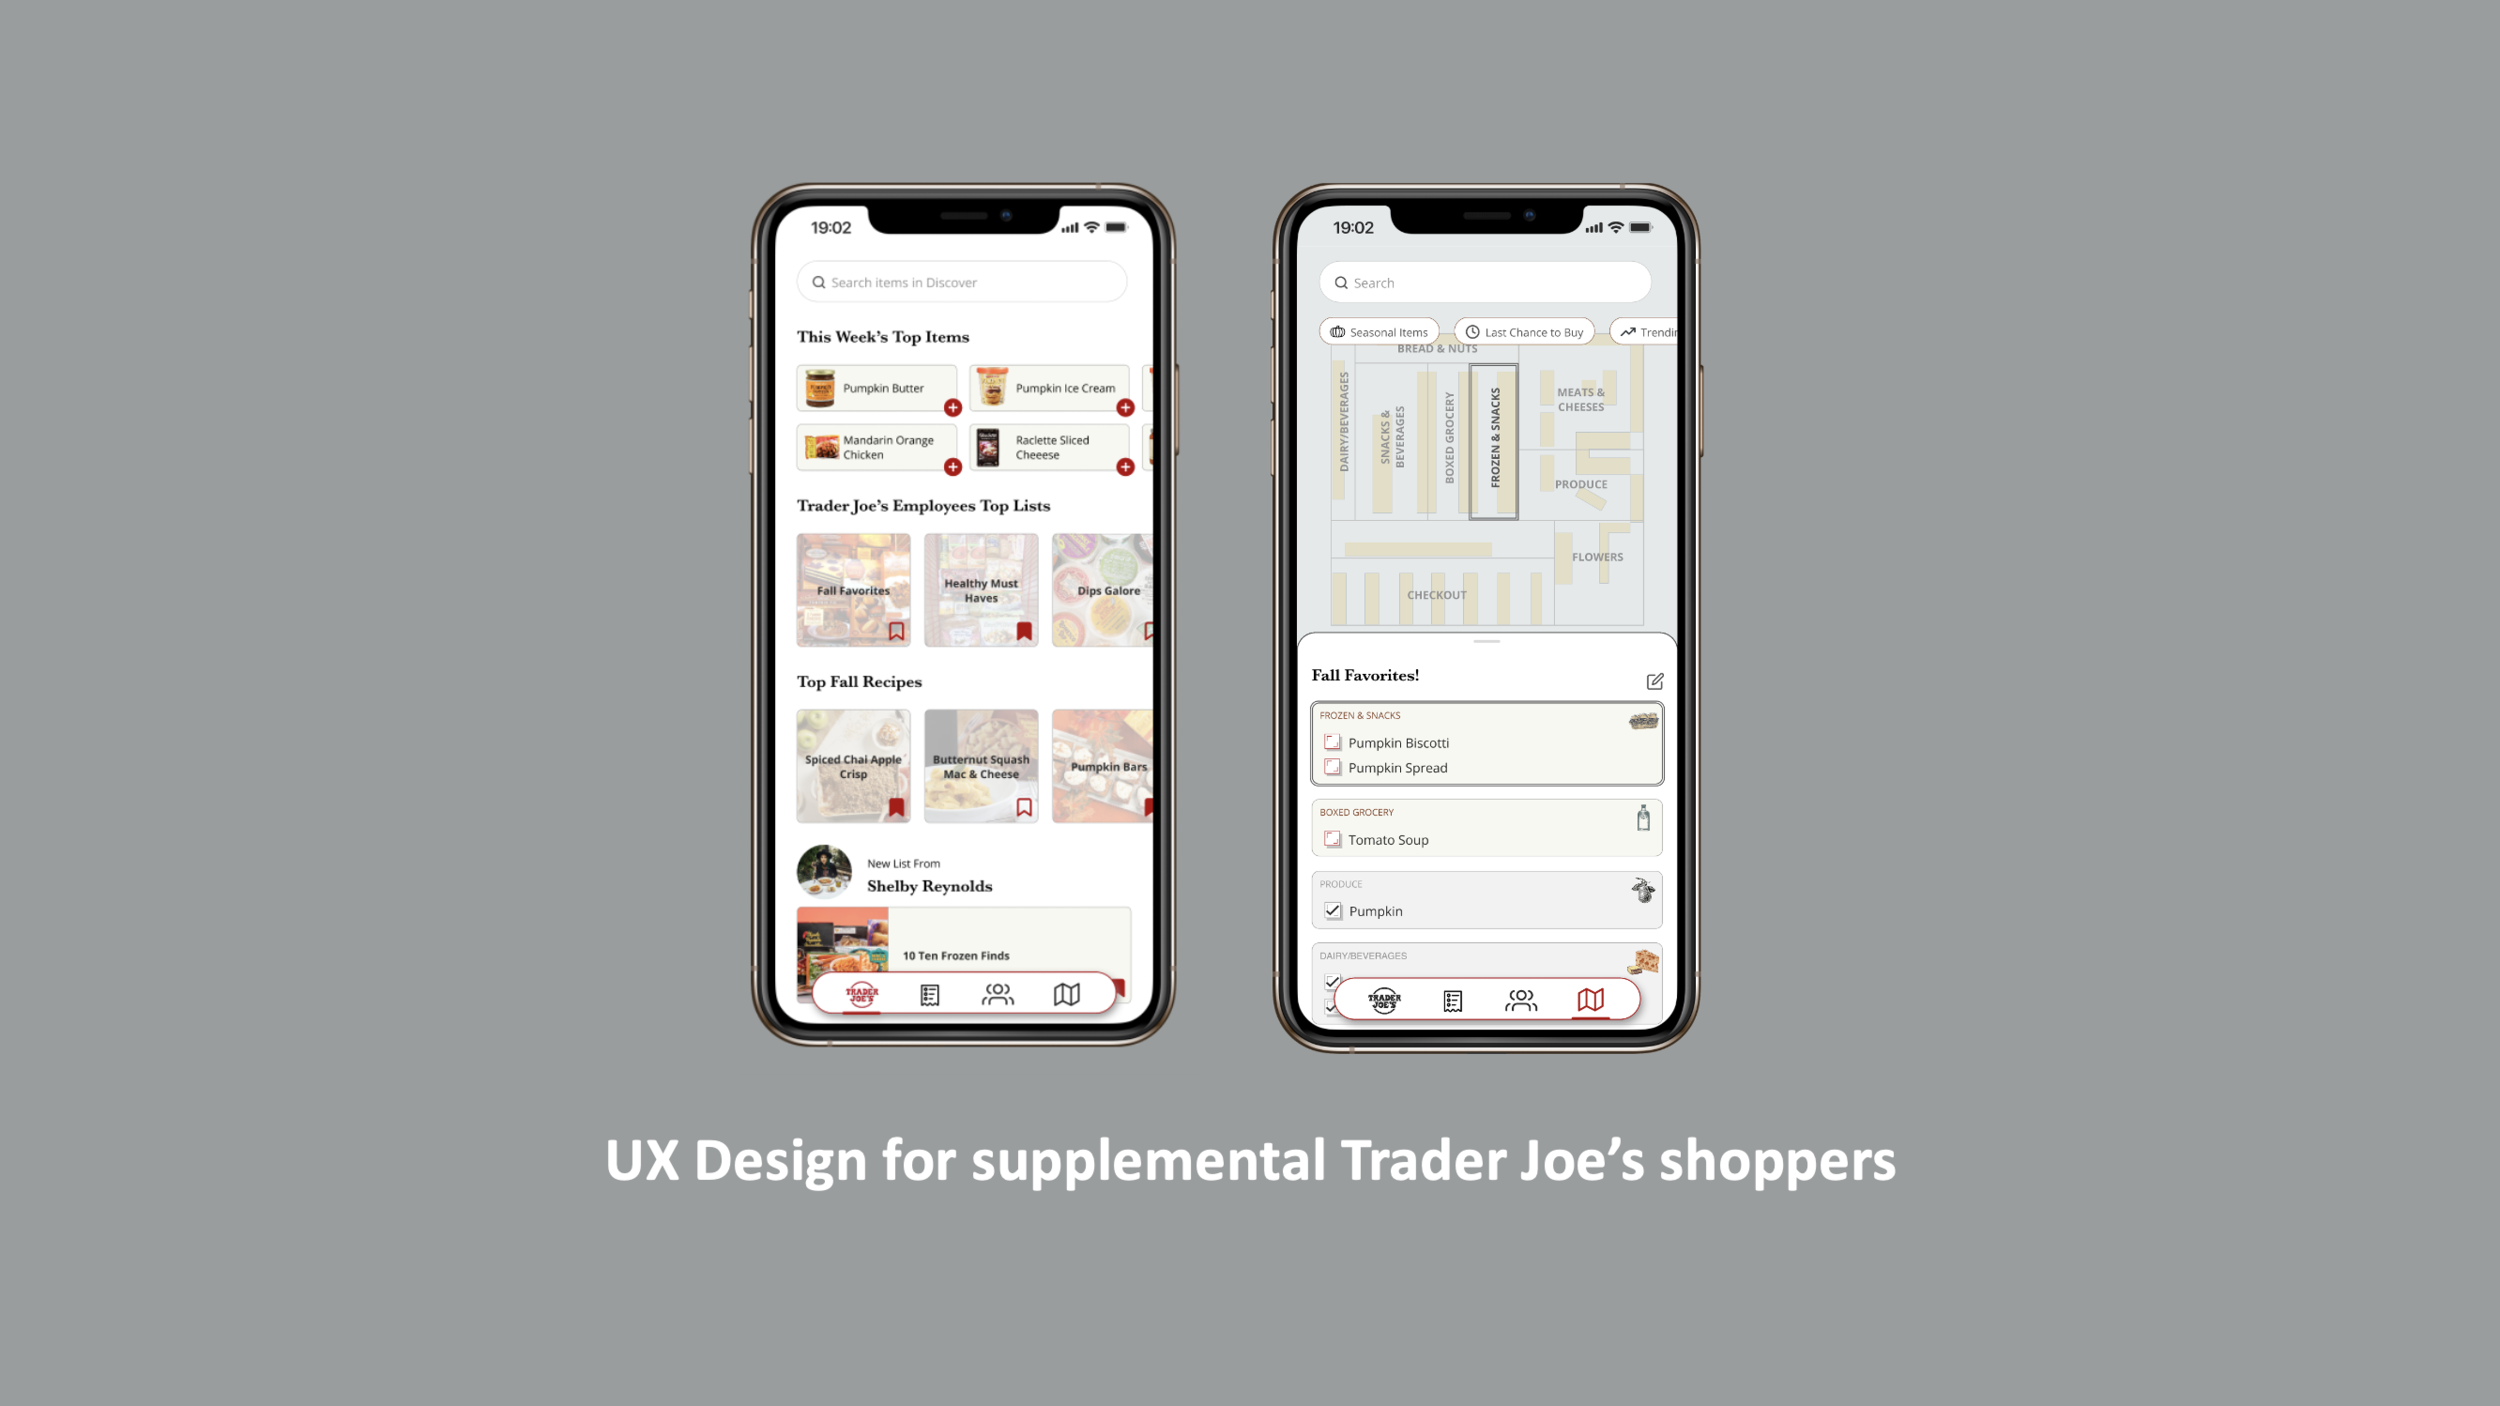
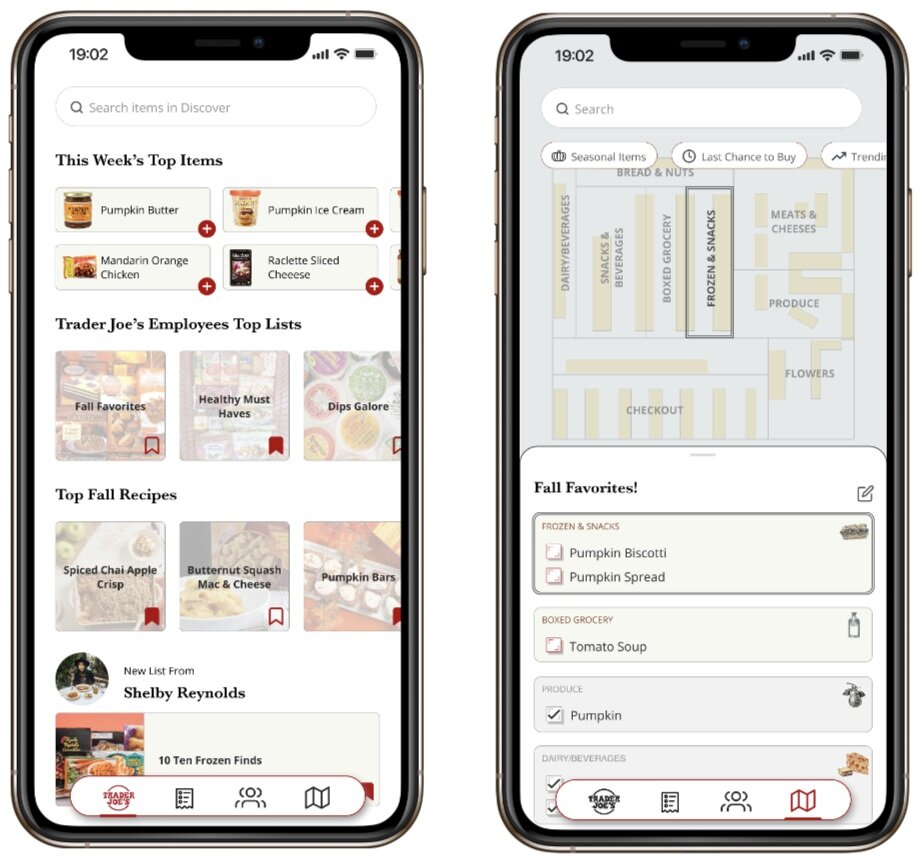
Once we had all of the wireframes to the fidelity that we wanted, we used Figma’s prototyping functionality to create flows based on the features we wanted to highlight in our final presentation. The features we chose to highlight and their prototyped flows can be seen in the GIFs below. For this project since we were working with engineers we had to take our wireframes one step further. We consolidated our style guide and created a version of the wireframes with arrows and comments to help with development. An example of the screens with hotspots and comments can be seen below.
Creating a list
Full map in-store navigation
Community page
Start shopping from list
Checking off and deleting items
User profile page
Start shopping from main nav bar
Selecting seasonal items pill
Searching for a product
Discover page
Example of the final wireframes with comments and hotspots for the engineers
final presentation
After finishing the final prototype, my team had the opportunity to show off our hard work in a final presentation to a group of our more senior colleagues. We received very positive feedback regarding the work we were able to accomplish over the two week project timeline. The recording of that presentation can be found here and a copy of our slide deck can be found here.
Potential Impact / Future Steps
Our TJs Shop app is the first mobile app from Trader Joe's. For large grocery store chains like Whole Foods, Meijer, and Roundy's, it is standard to have a mobile app with an in-store navigation system. Trader Joe's is behind, and our app will help them bridge that gap. Additionally, Trader Joe's has a unique, almost cult following from its customers. Our social component allows Trader Joe's to more effectively capitalize on the social following they have had for years. Finally, our app will allow Trader Joe's to make more informed decisions with user data. They will be able to suggest products to specific users based off of their purchasing history, views, and community connections to increase revenue. It can also help Trader Joe’s better understand which products generate excitement from their target customer. Our app is a starting point and in future iterations we would include several features to both improve the user experience and increase value for Trader Joe's. Features that we have discussed including in future iterations include: collaborative lists that you can create with friends and have the option to assign list items to people, a scan feature that would allow you to seamlessly add things to your list when shopping in store and could allow for a price checking, and in-app customer feedback. Additionally, if we had more time for this project we would want to conduct task based user testing in order to see how the experience could be improved.
Key Takeaways
As a team we really saw the importance of putting time towards the user research and brainstorming phases. Additionally, as experience designers it was important for us to advocate for this upfront work to take place before development started.
We learned about the importance of including the whole team in the brainstorming phase. We got a lot of new feature ideas when we were able to include all team members in ideating sessions.
We saw first hand how important it is that data be incorporated when creating personas so that the features ultimately address user pain points.
Our team learned a lot about how to control the scope of a project and focus on designing specific features at a time.
Contributions
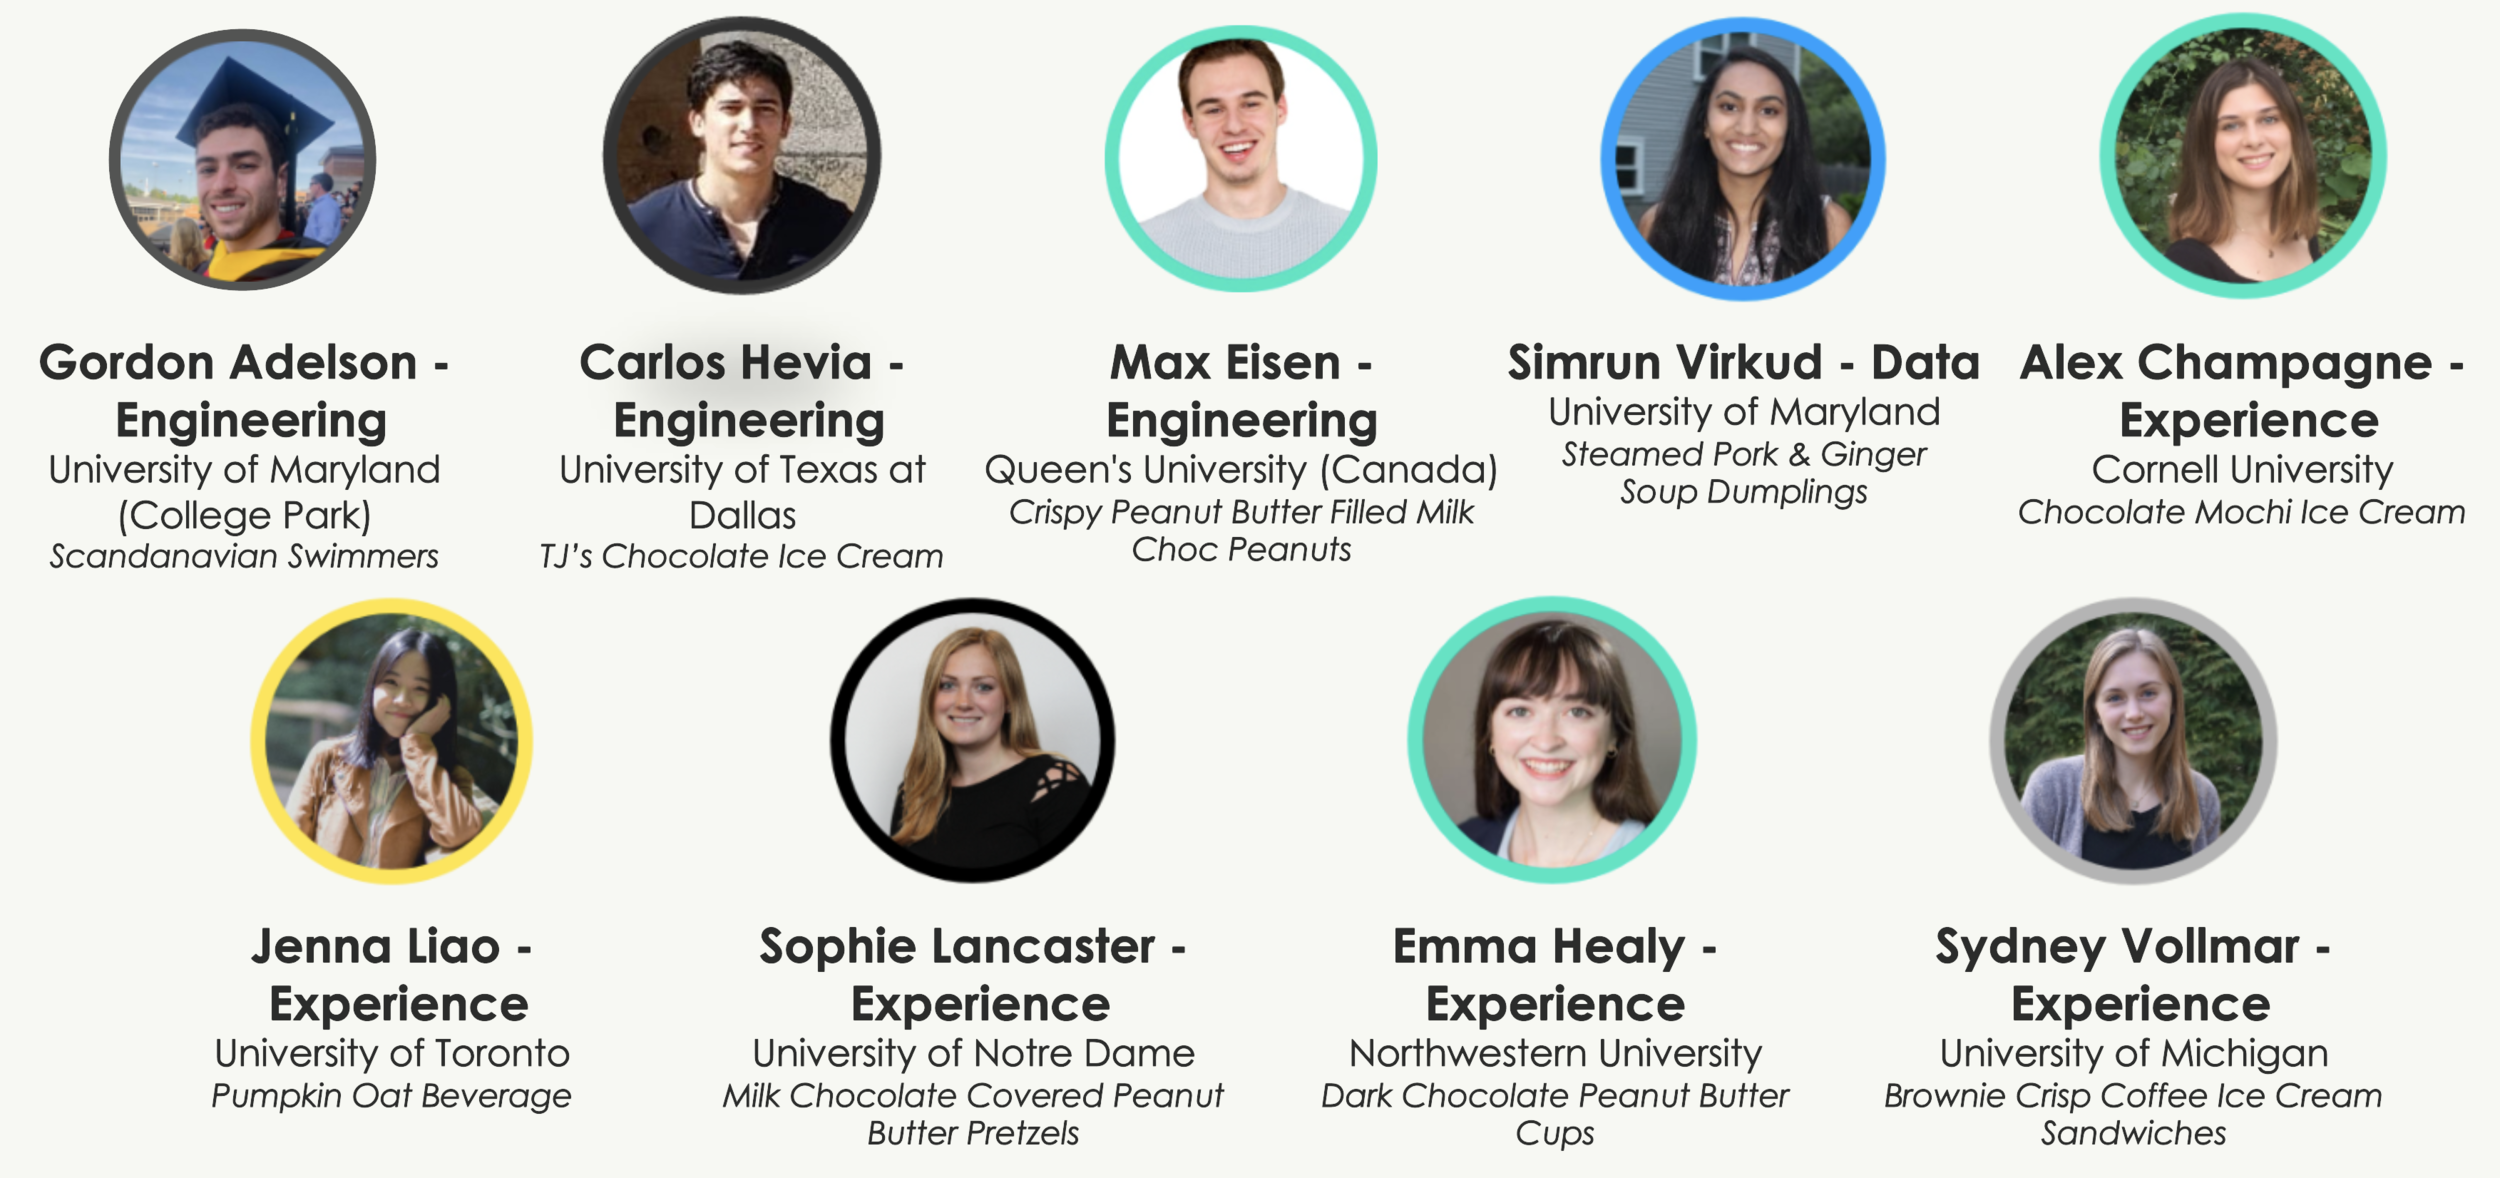
I would like to say a special thank you to my project team members, Sydney Vollmar, Alex Champagne, Emma Healy, Jenna Liao, Simrun Virkud, Gordon Adelson, Max Eisen and Carlos Hevia Alejano, my project coaches Satvika Luther, Soran Nouri and Someswara Phani Vepa and those who contributed through user research.


